


“Event Analytics helps you zoom out and truly understand the ‘why’ behind the ‘what.’”
Event Analytics has always been your microscope into how users behave. But today, we’re taking that microscope and turning it into a full-blown analytics lab.
Introducing Event Analytics 2.0 – redesigned, re-engineered, and re-imagined to give you unparalleled clarity into user behavior, customer value, and business levers that matter.
A Brand-New Event Analytics Experience
We rebuilt Event Analytics for a world where teams want to explore deeper, compare smarter, and answer questions faster. The new experience lets you:
- Split events by event or user attributes
- Compare splits side-by-side for instant insights
- Compare behavior across different time periods
- Choose flexible reporting windows (current week/month/quarter)
- Use metric cards – pin, monitor & track periodically
- Plot line charts, bars, and outcome metrics
- Go beyond event counts – measure impact (revenue, AOV, LTV, categories bought)
Split Events by Any Attribute – Event or User
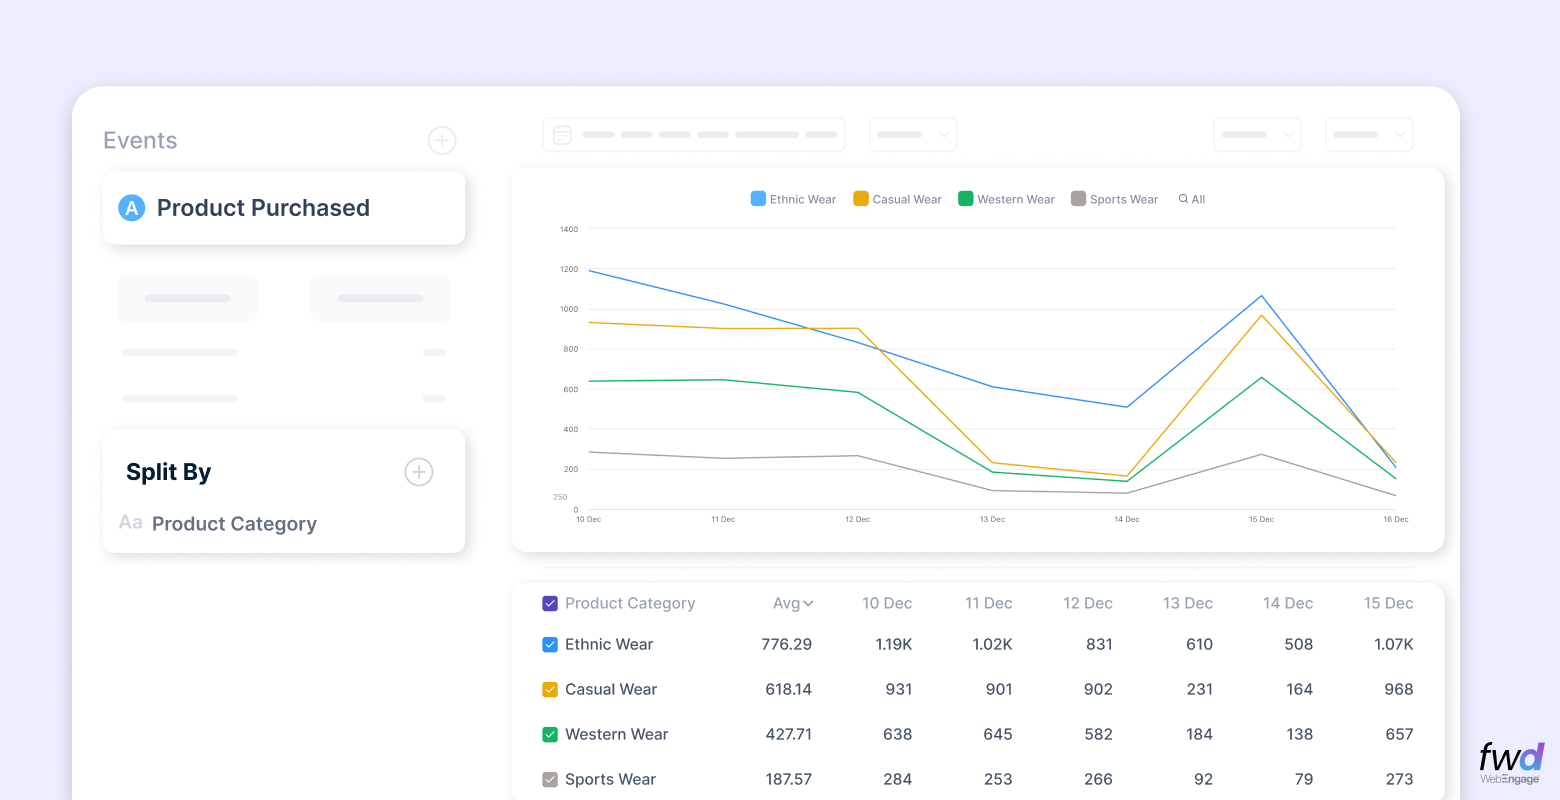 Splits allow you to break down an event into meaningful slices.
- Who performed this event?
- How did different segments behave?
- Which split drove the highest value?
Example splits:
- Event attribute: category viewed, payment method, plan type
- User attribute: age, loyalty tier, acquisition channel, city
Why it matters
You can now answer questions like:
- Which cities drive the highest “Add to Cart” events?
- Which payment methods correlate with highest AOV?
Compare Splits Side-by-Side
Instead of toggling between charts, see all performance variations in one view.

For example:
- Compare “Add to Cart” events split by Category
- Benchmark each city against any specific category like Ethnic Wear.
No extra steps. No duplicate tabs. No spreadsheets.
Compare Behavior Across Time
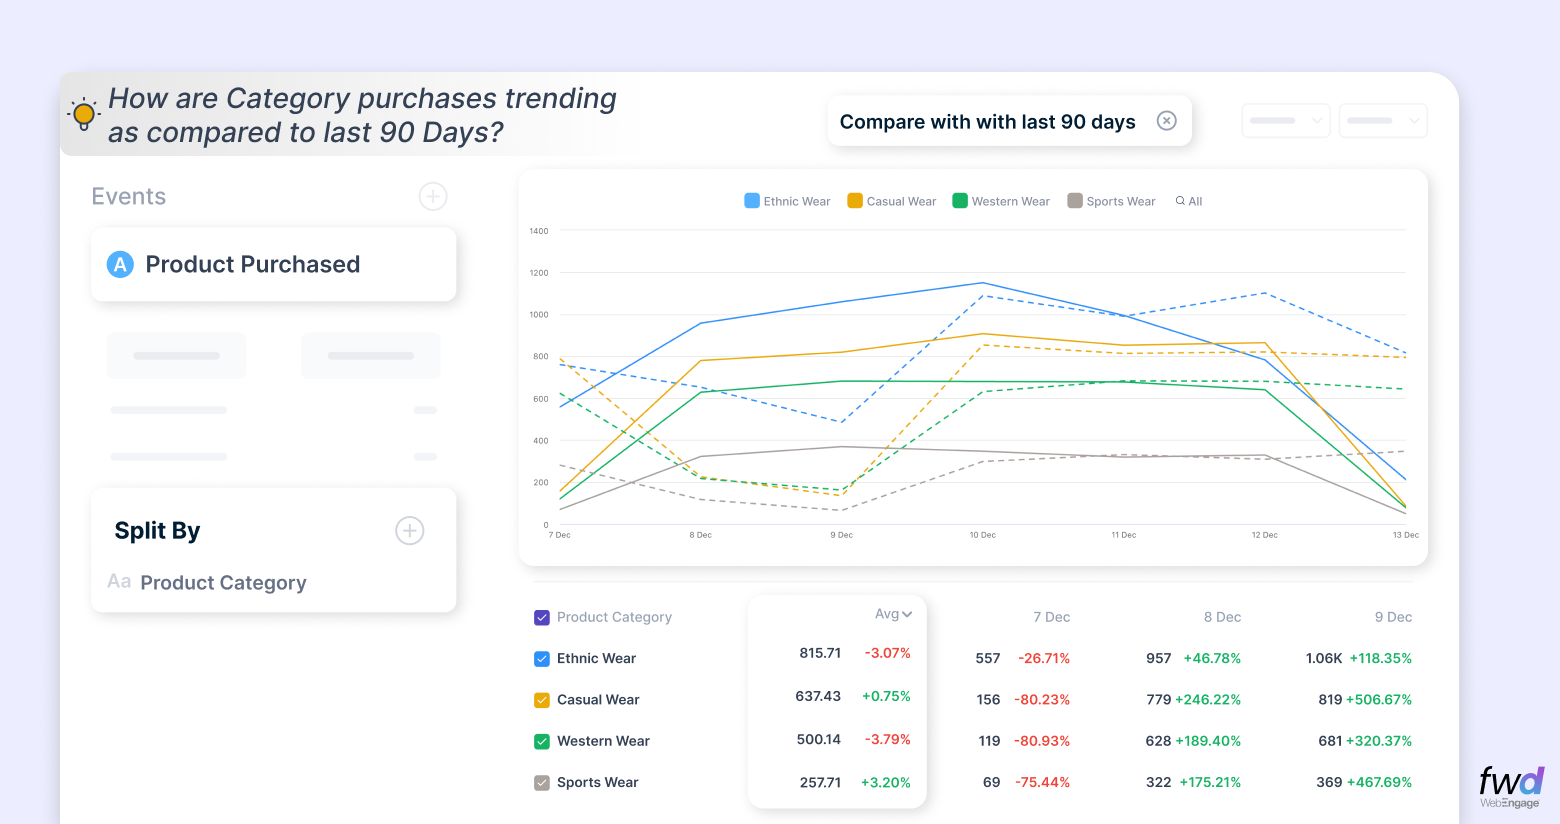
Understand how behavior evolves:
- This week vs last week
- Current month vs previous month
- Current quarter vs the last three quarters
Great for spotting seasonality, anomalies, and trends.
Reporting Period Flexibility
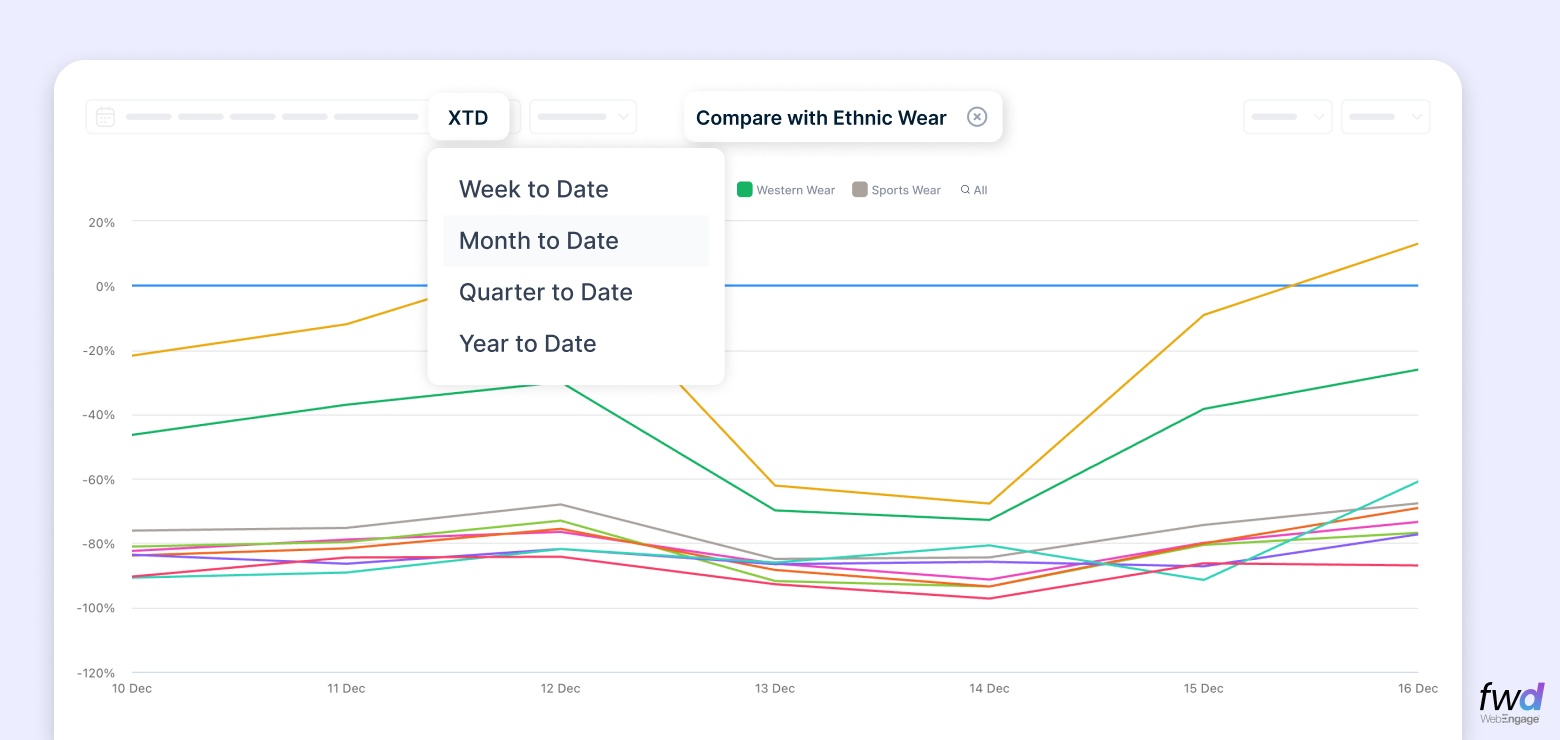
Sometimes, you don’t want “last 30 days.” Sometimes, you want the current month because campaigns reset every month. Event Analytics 2.0 offers:
- Current week
- Current month
- Current quarter
- Current year
The date range aligns with the natural rhythm of business reporting.
Metric Cards You Can Pin & Track Over Time
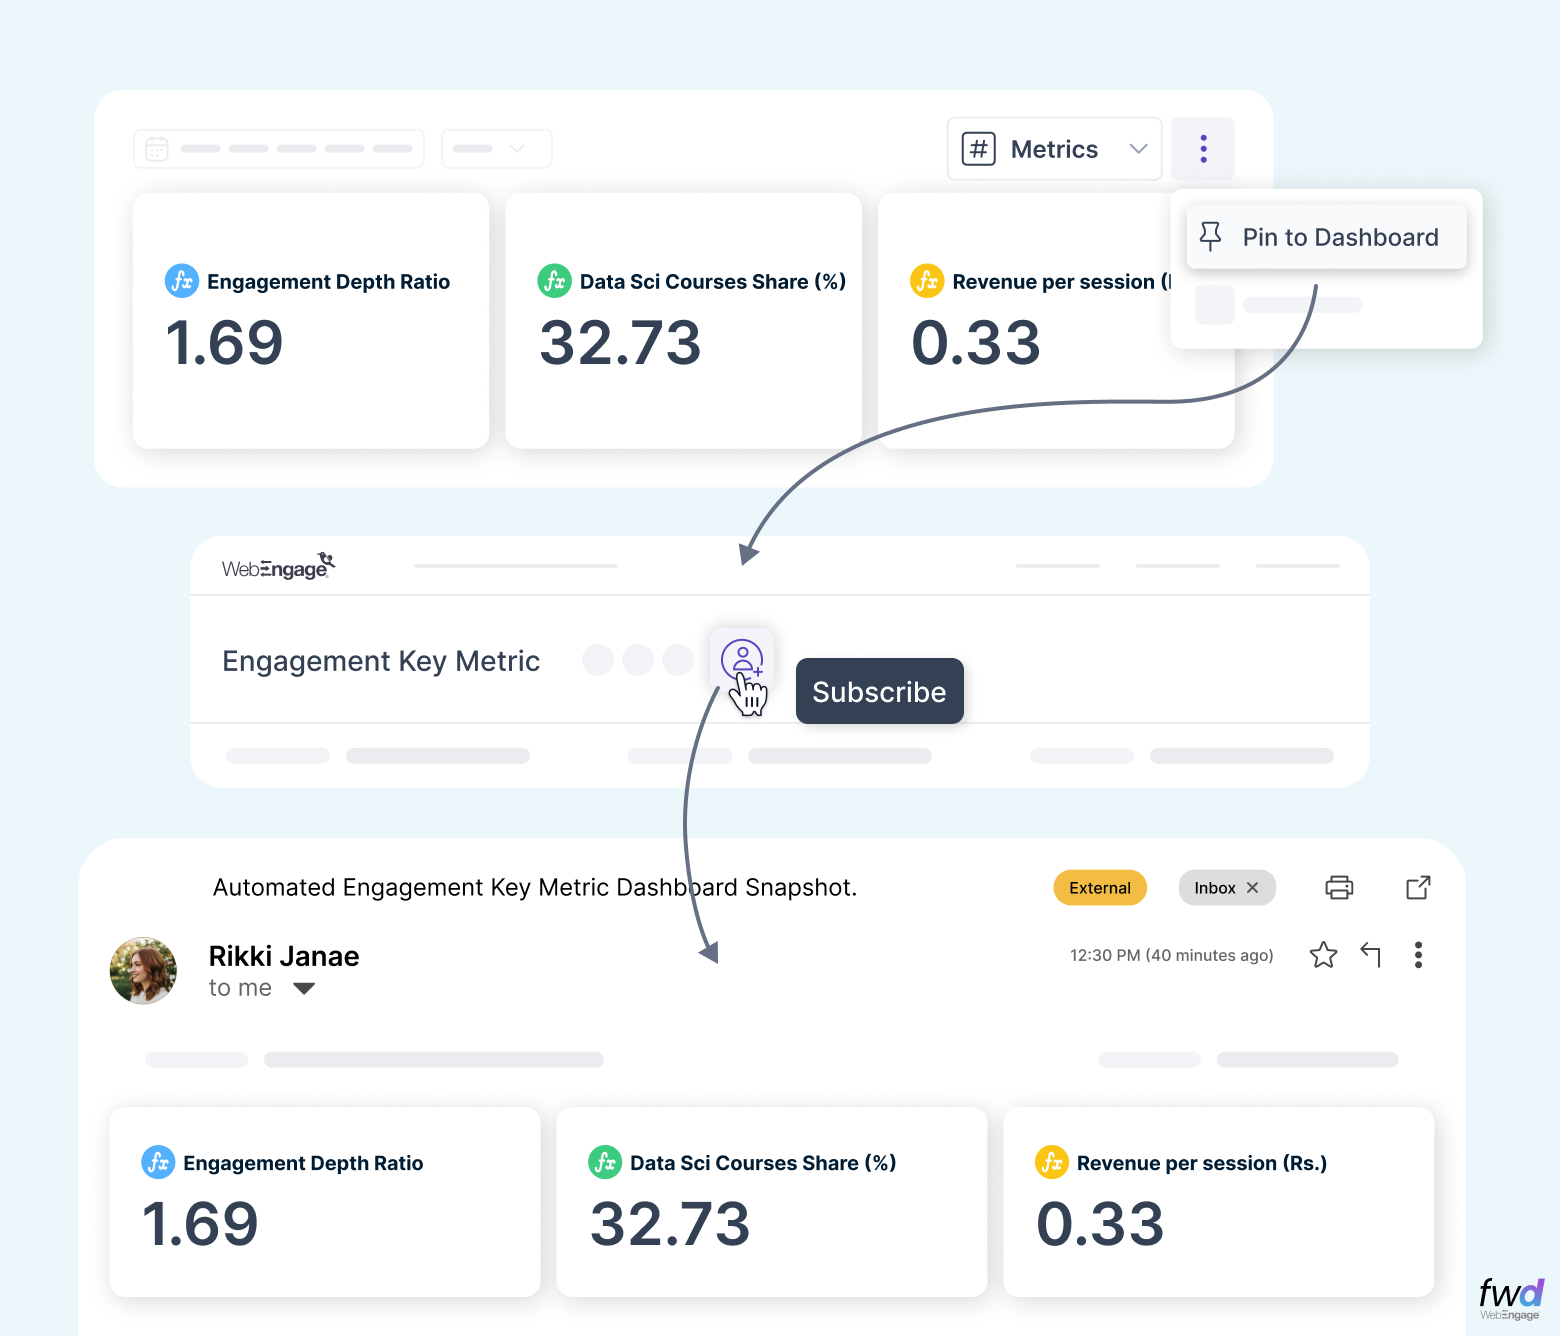
Metric Cards let you save the KPIs that matter most:
- “Add to Cart” volume
- Revenue from “Purchase” events
- New sign-ups from campaign X
- LTV of newly acquired users this quarter
Pin them. Track them. Share them with your team. Think of it as your personalized KPI watchlist.
Multiple Chart Types for Every Kind of Exploration
- 📈 Line charts – perfect for trends
- 📊 Bar charts – great for comparisons
- 🔢 Metric tiles – fast snapshots
Visual exploration is now fast, flexible, and intuitive.
Measure Not Just Volume – But Value
Volume tells you what users did. Value tells you what it meant. You can now plot:
- Revenue generated
- AOV (Average Order Value)
- LTV (Lifetime Value)
- Distinct categories purchased
This helps teams stop guessing and start prioritizing high-value behaviors.
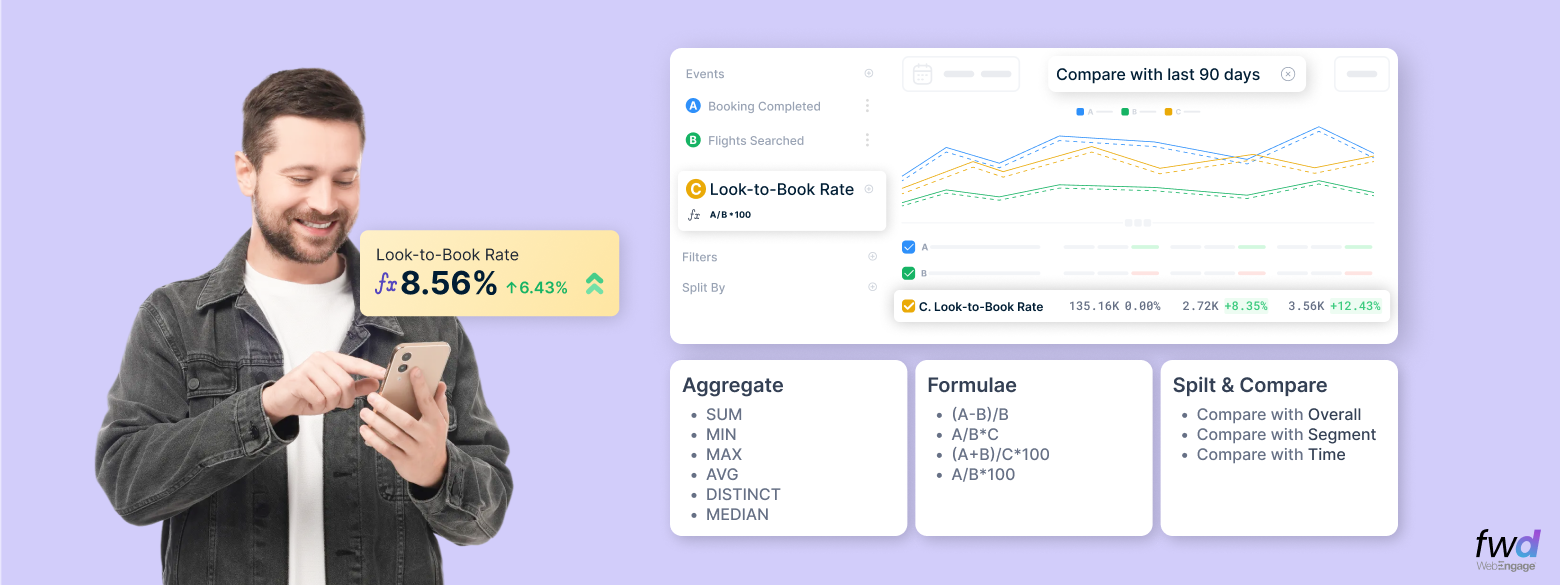
🎛 Formulas – Build Your Own Metrics
Create completely new business metrics using aggregates and derived formulas.
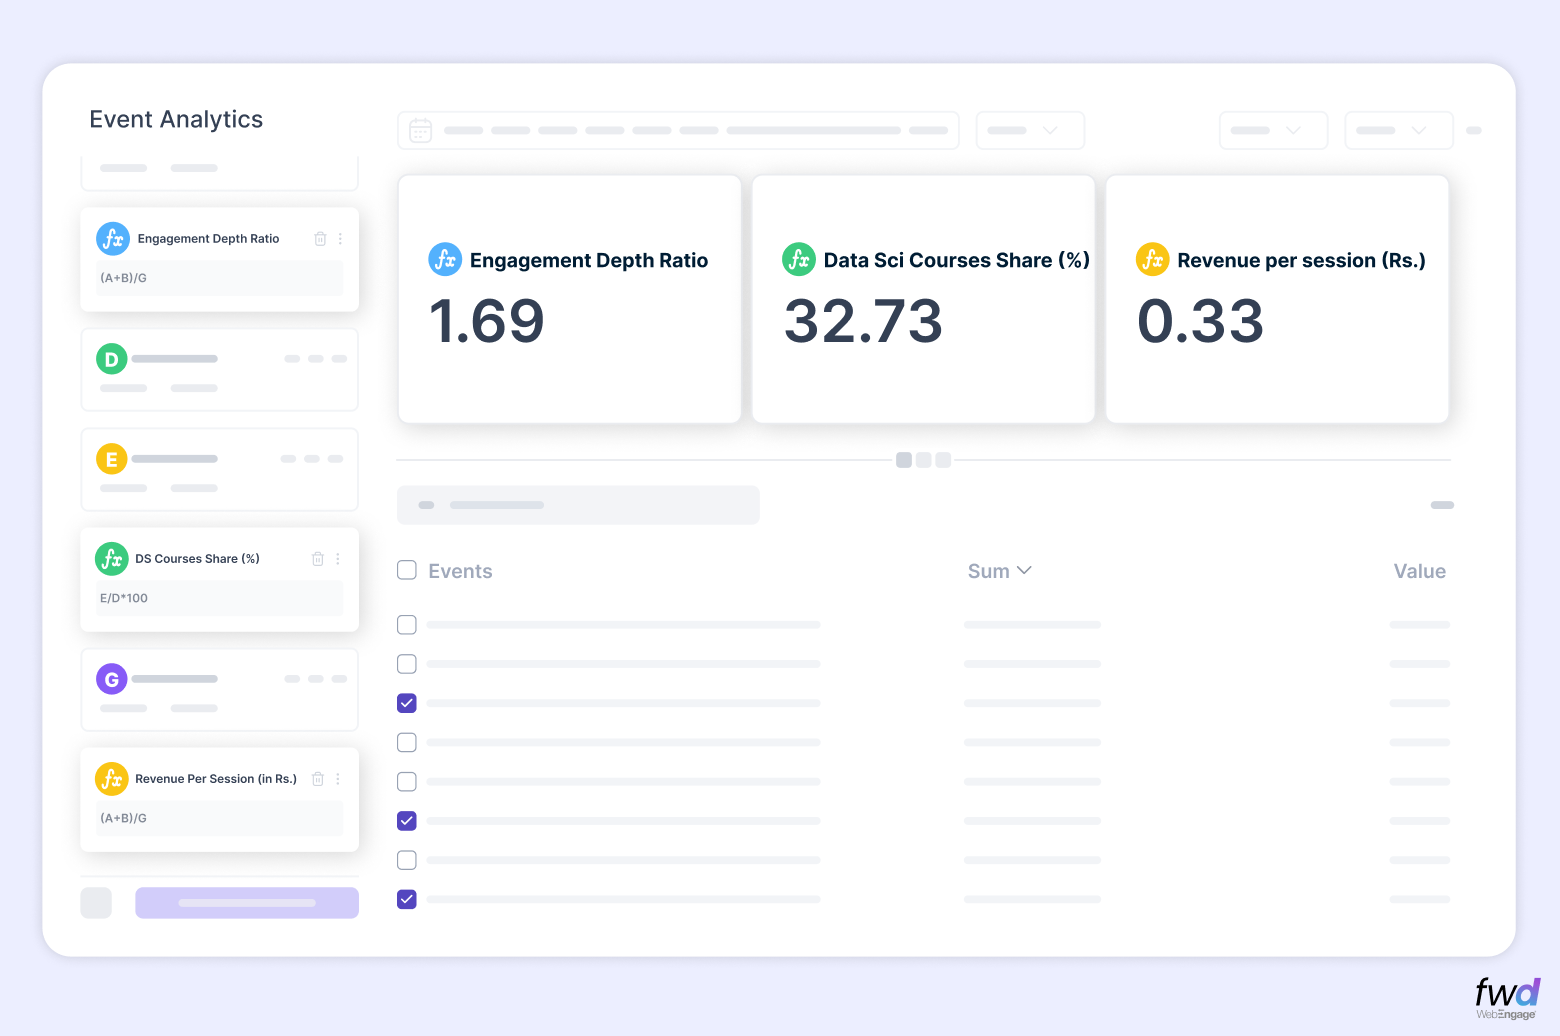
Examples
Engagement Depth Ratio
Total interactions (clicks + views + likes) / Sessions
Category Spend Share
Spend on Category X / Total Spend Examples:
- Fashion Spend Ratio
- Grocery Spend Ratio
- Electronics Spend Ratio
Campaign Touches per Purchase
Count of Purchases / Count of Email or Push Campaigns Understand the marketing effort required per purchase.
Industry Use Cases
🛒 E-Commerce & D2C
- Compare “Add to Cart” events split by category to find high-intent products
- Track AOV contribution by payment method
🎓 EdTech
- Track “Lesson Completed” rate by student segment
- Compare “Course Purchase” revenue month-over-month
🏦 FinTech
- Evaluate “Deposit Initiated” split by city or KYC status
- Track average wallet balance over time
- Build formulas like “Avg Transactions per Active User”
🍽️ Food Delivery
- Split “Order Completed” by platform (web vs app)
- Track “Average Delivery Fee Paid” as a recurring metric
💪 Health & Fitness Apps
- Compare “Subscription Renewals” across user groups
- Track “Average Sessions per Week” for high-engagers
Why Event Analytics 2.0 Matters
Because modern teams don’t want dashboards.
They want answers. They want context. They want clarity.
Event Analytics 2.0 turns raw events into business insights – fast, flexible, and frictionless.

 Ananya Nigam
 Harshita Lal
 Ryan Dsouza
 Diksha Dwivedi